


Space Weather Observations, Alerts, and Forecast
3-day Solar-Geophysical Forecast
Product: 3-Day Forecast
- Issued: 2024 Apr 20 0030 UTC
Prepared by the U.S. Dept. of Commerce, NOAA, Space Weather Prediction Center.
Geomagnetic Activity Observation and Forecast
The greatest observed 3 hr Kp over the past 24 hours was 7 (NOAA Scale G3). The greatest expected 3 hr Kp for Apr 20-Apr 22 2024 is 3.67 (below NOAA Scale levels).
| Apr 20 | Apr 21 | Apr 22 | |
|---|---|---|---|
| 00-03UT | 2.67 | 3.00 | 2.33 |
| 03-06UT | 3.67 | 3.67 | 2.67 |
| 06-09UT | 2.67 | 2.67 | 2.00 |
| 09-12UT | 2.00 | 2.67 | 2.33 |
| 12-15UT | 0.67 | 2.00 | 2.00 |
| 15-18UT | 1.67 | 2.00 | 1.67 |
| 18-21UT | 2.00 | 3.00 | 1.67 |
| 21-00UT | 2.67 | 2.00 | 2.33 |
Rationale: No G1 (Minor) or greater geomagnetic storms are expected.
Solar Radiation Activity Observation and Forecast
Solar radiation, as observed by NOAA GOES-18 over the past 24 hours, was below S-scale storm level thresholds.
| Apr 20 | Apr 21 | Apr 22 | |
|---|---|---|---|
| S1 or greater | 20% | 20% | 20% |
Rationale: There is a slight chance for S1 (Minor) solar radiation storm conditions over 20-22 Apr due to the flare potential of several active regions on the visible disk.
Radio Blackout Activity and Forecast
Radio blackouts reaching the R1 levels were observed over the past 24 hours. The largest was at Apr 19 2024 0453 UTC.
| Apr 20 | Apr 21 | Apr 22 | |
|---|---|---|---|
| R1-R2 | 75% | 75% | 75% |
| R3 or greater | 20% | 20% | 20% |
Rationale: R1-R2 (Minor-Moderate) events are expected, with a slight chance for R3 (Strong) or greater events, over 20-22 Apr due to the flare potential of several active regions on the visible disk.
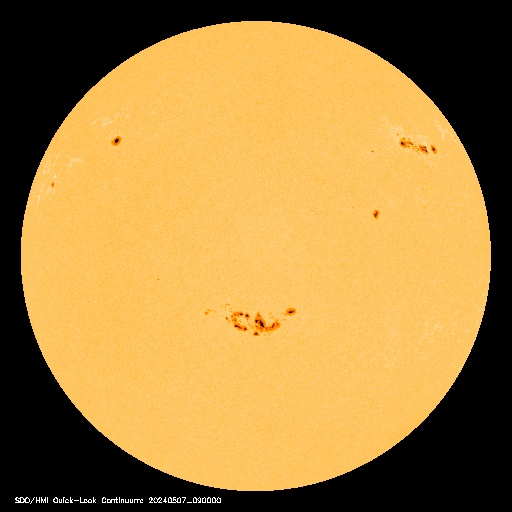
Real Time Images of the Sun


The sun is constantly monitored for sun spots and coronal mass ejections. EIT (Extreme ultraviolet Imaging Telescope) images the solar atmosphere at several wavelengths, and therefore, shows solar material at different temperatures. In the images taken at 304 Angstrom the bright material is at 60,000 to 80,000 degrees Kelvin. In those taken at 171 Angstrom, at 1 million degrees. 195 Angstrom images correspond to about 1.5 million Kelvin, 284 Angstrom to 2 million degrees. The hotter the temperature, the higher you look in the solar atmosphere.
Current Space Weather
|

|
SDO-NASA and the [AIA, EVE, and/or HMI] consortium. Primer on Space Weather |
Current Sunspot Activity
 NASA/SOHO Current Sunspot Activity Sunspots Yesterday: Warning: fopen(/home/xxxxx/public_html/xxxx/sunspots/cacheyest.txt): failed to open stream: No such file or directory in /home2/satellitecop/public_html/sunspots/sunspotsyest.php on line 65 error cant find cache file - /home/xxxxx/public_html/xxxx/sunspots/cacheyest.txt 243 Click for sunspot listing for the current Year Sunspot graph and scripts courtesy of: Newquay Weather |
Sunspots Last Quarter Click for sunspot listing for the current quarterSunspot graph and scripts courtesy of: Newquay Weather |
Sunspots Last 30 Days Click for sunspot listing for the last 30 daysSunspot graph and scripts courtesy of: Newquay Weather |
- Sunspots are solar magnetic storms. The spots appear darker because the temperature of the spots are lower than the surrounding photosphere.
- They serve as a reservoir for solar flares and coronal mass ejections, which cause Aurorae, power/communication outages, and satellite anomalies.
- The Suns activity waxes and wanes in an 11-year sunspot cycle; Solar Minimum is when the number of sunspots are lowest.
- There seems to be a correlation between Solar Min/Maximum and Earths weather. The extent to which Ozone, stratospheric winds, global circulation patterns, and cloud seeding are all affected are still being studied.

Real Time Solar Corona
| The Corona is the Suns outer atmosphere. It is visible during total eclipses of the Sun as a pearly white crown surrounding the Sun. The corona displays a variety of features including streamers, plumes, and loops. These features change from eclipse to eclipse and the overall shape of the corona changes with the sunspot cycle. |


| The Large Angle and Spectrometric COronagraph (LASCO) instrument is one of 11 instruments included on the joint NASA/ESA SOHO (Solar and Heliospheric Observatory) spacecraft. SOHO was launched on 2 December 1995 at 0808 UT (0308 EST) from the Kennedy Space Center, Cape Canaveral, Florida. The LASCO instrument is a set of three coronagraphs that image the solar corona from 1.1 to 32 solar radii. It is convenient to measure distances in terms of solar radii. One solar radius is about 700,000 km, 420,000 miles or 16 arc minutes. A coronagraph is a telescope that is designed to block light coming from the solar disk, in order to see the extremely faint emission from the corona. |
Real Time Solar Wind
| The solar wind is a stream of charged particles released from the upper atmosphere of the Sun. This plasma consists of mostly electrons, protons and alpha particles with energies usually between 1.5 and 10 keV; embedded in the solar-wind plasma is the interplanetary magnetic field. The solar wind varies in density, temperature and speed over time and over solar longitude. Its particles can escape the Suns gravity because of their high energy, from the high temperature of the corona and magnetic, electrical and electromagnetic phenomena in it. The solar wind streams off of the Sun in all directions at speeds of about 400 km/s (about 1 million miles per hour). The source of the solar wind is the Suns hot corona. The temperature of the corona is so high that the Suns gravity cannot hold on to it. Although we understand why this happens we do not understand the details about how and where the coronal gases are accelerated to these high velocities. This question is related to the question of coronal heating. The solar wind is not uniform. Although it is always directed away from the Sun, it changes speed and carries with it magnetic clouds, interacting regions where high speed wind catches up with slow speed wind, and composition variations. The solar wind speed is high (800 km/s) over coronal holes and low (300 km/s) over streamers. These high and low speed streams interact with each other and alternately pass by the Earth as the Sun rotates. These wind speed variations buffet the Earths magnetic field and can produce storms in the Earths magnetosphere. |
Satellite Environment Plot Plot Courtesy of: Space Weather Predition Center National Oceanic and Atmospheric Administration The Satellite Environment Plot combines satelliteand ground-based data to provide an overview of the current geosynchronous satellite environment. |
   |
Real-Time Solar Wind
Plot Courtesy of: Space Weather Predition Center National Oceanic and Atmospheric Administration Real-Time Solar Wind data broadcast from NASAs ACE satellite. |
Solar Cycle
| The recent Solar Cycle is represented in several ways. On the left is the Sunspot Number, in the middle, the F10.7cm Radio Flux, and on the right, the Ap Index (a measure of geomagnetic activity) history. In all of the plots, the black line represents the monthly averaged data and the blue line represents a 13-month smoothed version of the monthly averaged data. For the Sunspot Number and F10.7cm, the forecast for the rest of the solar cycle is given by the red line. Solar cycle predictions are used by various agencies and many industry groups. The solar cycle is important for determining the lifetime of satellites in low-Earth orbit, as the drag on the satellites correlates with the solar cycle, especially as represented by F10.7cm. A higher solar maximum decreases satellite life and a lower solar maximum extends satellite life. Also, the prediction gives a rough idea of the frequency of space weather storms of all types, from radio blackouts to geomagnetic storms to radiation storms, so is used by many industries to gauge the expected impact of space weather in the coming years. |
Sun Spot Number Progression Plot Courtesy of: Space Weather Predition Center National Oceanic and Atmospheric Administration This plot shows the Solar Cycle Sun Spot Number Progression. |
F10.7cm Radio Flux Progression Plot Courtesy of: Space Weather Predition Center National Oceanic and Atmospheric Administration This plot shows the F10.7cm Radio Flux Progression. |
Ap Progression Plot Courtesy of: Space Weather Predition Center National Oceanic and Atmospheric Administration This plot shows the Solar Cycle Ap Progression. |
The Solar Cycle is observed by counting the frequency and placement of sunspots visible on the Sun.
Solar minimum occurred in December, 2008.
Solar maximum appears to have occured in 2014.
Solar Storms
 |
Solar Radiation Storms:
The Proton Flux shows the last 3 days of data for the most dangerous part of a Solar Storm; Solar Radiation. Note the left side Particles value of 101 through 105 MeV for the red band, and the duration of the storm. Match with the Solar Radiation Storm column in the scale. |

|
Radio Blackouts: This plot
shows the last 3 days of Solar X-ray values for the part of Solar Storms causing radio blackouts. Note the left side (W/m2) of 10-5 through 10-2 and note the right side M or X. Match with Radio Blackouts column in the scale. An Xray Flux of 10-3 in the X20 range (very top plot w/out a value in the right side) is indicative of an EXTREME (R5) event-radio blackout on the entire sunlit side of Earth lasting for a number of hours. |
 |
Geomagnetic Storms This
plot shows Geomagnetic Storm strength. Note the left side Kp value of 5 through 9 (<5 not an event) and
duration. Match with the Geomagnetic Storm column in the
scale.
eg. A Kp 7 event is a STRONG (G3) event-HF radio may be intermittent, and aurora have
been seen as low as Illinois and Oregon. |
Interplanetary Magnetic Field
| The interplanetary magnetic field (IMF) is a part of the Suns magnetic field that is carried into interplanetary space by the solar wind. The interplanetary magnetic field lines are said to be "frozen in" to the solar wind plasma. Because of the Suns rotation, the IMF, like the solar wind, travels outward in a spiral pattern. The IMF originates in regions on the Sun where the magnetic field is "open"--that is, where field lines emerging from one region do not return to a conjugate region but extend virtually indefinitely into space. The direction (polarity, sense) of the field in the Suns northern hemisphere is opposite that of the field in the southern hemisphere. (The polarities reverse with each solar cycle.) |
 |
 |

|

|
| IMF Dials courtesy: Rice Space Institute |
Auroral Activity Extrapolated from NOAA POES
| Named for the Roman goddess of dawn, the aurora is a mysterious and unpredictable display of light in the night sky. The aurora borealis and aurora australis – often called the northern lights and southern lights – are common occurrences at high northern and southern latitudes, less frequent at mid-latitudes, and seldom seen near the equator. While usually a milky greenish color, auroras can also show red, blue, violet, pink, and white. These colors appear in a variety of continuously changing shapes. Sometimes the aurora is so dim and scattered as to be mistaken for clouds or the Milky Way; sometimes it is bright enough to read by. Auroras are a spectacular sign that our planet is electrically connected to the Sun. These light shows are provoked by energy from the Sunand fueled by electrically charged particles trapped in Earth’s magnetic field. While beautiful to behold, they can be a nuisance to those who depend on modern technology. The typical aurora is caused by collisions between fast-moving electrons from space with the oxygen and nitrogen in Earths upper atmosphere. The electrons which come from the Earths magnetosphere, the region of space controlled by Earths magnetic field transfer their energy to the oxygen and nitrogen atoms and molecules, making them “excited”. As the gases return to their normal state, they emit photons, small bursts of energy in the form of light. When a large number of electrons come from the magnetosphere to bombard the atmosphere, the oxygen and nitrogen can emit enough light for the eye to detect, giving us beautiful auroral displays. This ghostly light originates at altitudes of 100 to more than 400 km (60 to more than 250 miles). |


Instruments on board the NOAA Polar-orbiting Operational Environmental Satellite (POES) continually monitor the power flux carried by the protons and electrons that produce aurora in the atmosphere. SWPC has developed a technique that uses the power flux observations obtained during a single pass of the satellite over a polar region (which takes about 25 minutes) to estimate the total power deposited in an entire polar region by these auroral particles. The power input estimate is converted to an auroral activity index that ranges from 1 to 10.
VHF and HF Band Conditions
| Space weather impacts radio communication in a number of ways. At frequencies in the 1 to 30 mega Hertz range (known as “High Frequency” or HF radio), the changes in ionospheric density and structure modify the transmission path and even block transmission of HF radio signals completely. These frequencies are used by amateur (ham) radio operators and many industries such as commercial airlines. They are also used by a number of government agencies such as the Federal Emergency Management Agency and the Department of Defense. There are several types of space weather that can impact HF radio communication. In a typical sequence of space weather storms, the first impacts are felt during the solar flare itself. The solar x-rays from the sun penetrate to the bottom of the ionosphere (to around 80 km). There the x-ray photons ionize the atmosphere and create an enhancement of the D layer of the ionosphere. This enhanced D-layer acts both as a reflector of radio waves at some frequencies and an absorber of waves at other frequencies. The Radio Blackout associated with solar flares occurs on the dayside region of Earth and is most intense when the sun is directly overhead. Another type of space weather, the Radiation Storm caused by energetic solar protons, can also disrupt HF radio communication. The protons are guided by Earth’s magnetic field such that they collide with the upper atmosphere near the north and south poles. The fast-moving protons have an affect similar to the x-ray photons and create an enhanced D-Layer thus blocking HF radio communication at high latitudes. During auroral displays, the precipitating electrons can enhance other layers of the ionosphere and have similar disrupting and blocking effects on radio communication. This occurs mostly on the night side of the polar regions of Earth where the aurora is most intense and most frequent. |
|
HF and VHF Conditions |
| In radio transmission maximum usable frequency (MUF) is the highest radio frequency that can be used for transmission between two points via reflection from the ionosphere (skywave or "skip" propagation) at a specified time, independent of transmitter power. This index is especially useful in regard to shortwave transmissions. In shortwave radio communication, a major mode of long distance propagation is for the radio waves to reflect off the ionized layers of the atmosphere and return diagonally back to Earth. In this way radio waves can travel beyond the horizon, around the curve of the Earth. However the refractive index of the ionosphere decreases with increasing frequency, so there is an upper limit to the frequency which can be used. Above this frequency the radio waves are not reflected by the ionosphere but are transmitted through it into space. |
|
Current World Sunlight Map Solar Flux Maximum Usable Frequency readings |
| The K-index, and by extension the Planetary K-index, are used to characterize the magnitude of geomagnetic storms. Kp is an excellent indicator of disturbances in the Earths magnetic field and is used by SWPC to decide whether geomagnetic alerts and warnings need to be issued for users who are affected by these disturbances. The principal users affected by geomagnetic storms are the electrical power grid, spacecraft operations, users of radio signals that reflect off of or pass through the ionosphere, and observers of the aurora. The K-index is a code that is related to the maximum fluctuations of horizontal components observed on a magnetometer relative to a quiet day, during a three-hour interval. The conversion table from maximum fluctuation (nT) to K-index, varies from observatory to observatory in such a way that the historical rate of occurrence of certain levels of K are about the same at all observatories. In practice this means that observatories at higher geomagnetic latitude require higher levels of fluctuation for a given K-index. At SWPC, we monitor the preliminary values of the K-index, minute by minute, from a network of observatories that relay data in near-real time. The final K-indices are determined after the end of prescribed three hourly intervals (0000-0300, 0300-0600, ..., 2100-2400). The maximum positive and negative deviations during the 3-hour period are added together to determine the total maximum fluctuation. These maximum deviations may occur anytime during the 3-hour period. The A-index is calculated for individual magnetometer stations. The value is calculated as the average of eight, three-hourly station ak-indices observed during a UT day, and provides a single, average value to indicate the activity level for that day. The ak index is a 3-hourly equivalent amplitude index of geomagnetic activity for a specific station expressing the range of disturbance in the horizontal components. ak is scaled from the 3-hourly station K-index. The ak values can be converted to nanoteslas (nT) using a local, station-dependent conversion factor. The conversion factor is found by dividing the stations lower limit for K=9 by 250. For example, at Boulder and Fredericksburg the lower limit for K=9 is 500 nT so the factor is 2; therefore the ak values for these stations are in units of 2 nT. (To obtain an equivalent amplitude in nanotesla for Boulder or Fredericksburg, the index value must be doubled.) The Solar Flux Index (SFI) is a gauge of solar particles and magnetic fields reaching our atmosphere. Higher numbers mean more solar wind is reaching the earth thus better propagation. |
|
Solar Flux Last 30 days |
| F2-layer is the most important ionospheric layer for long-distance, multiple-hop HF propagation, though F1, E, and D-layers also play significant roles. The D-layer, when present during sunlight periods, causes significant amount of signal loss, as does the E-layer whose maximum usable frequency can rise to 4 MHz and above and thus block higher frequency signals from reaching the F2-layer. The layers, or more appropriately "regions", are directly affected by the sun on a daily diurnal cycle, a seasonal cycle and the 11-year sunspot cycle and determine the utility of these modes. During solar maxima, or sunspot highs and peaks, the whole HF range up to 30 MHz can be used usually around the clock and F2 propagation up to 50 MHz is observed frequently depending upon daily solar flux 10.7cm radiation values. During solar minima, or minimum sunspot counts down to zero, propagation of frequencies above 15 MHz is generally unavailable. The F2 layer exists from about 220 to 800 km above the surface of the Earth. The F2 layer is the principal reflecting layer for HF communications during both day and night. The horizon-limited distance for one-hop F2 propagation is usually around 4,000 km. Variations are usually large, irregular, and particularly pronounced during magnetic storms. |
 Courtesy of IPS Space Weather |
The data presented in IPS Space Weather Chart are derived from the automated interpretation of ionograms from around the world. Regional data are obtained from the IPS space weather observation network known as IPSNET, (Australia Pacific Region). Global data are obtained from the NICT Space Weather Information Centre of Japan (Japanese region), the Space Physics Group at Rhodes Universitys Hermanus Magnetic Observatory (South African region), the Istituto Nazionale di Geofisica e Vulcanolgia, Rome, Italy (Italian Region), the Facultad Regional Tucumn, Universidad Tecnolgica Nacional, Argentina, (South American Region), the Global Ionospheric Radio Observatory (GIRO), and the United States of America Space Weather Prediction Centre (SWPC). The ionospheric data available from the SWPC and GIRO are contributed by the International Space Environment Services (ISES) Regional Warning Centres (RWCs) located around the globe, the United States Air Force (USAF) and several research institutes. Note: The foF2 values used in the mapping process are based on the median of the last 2 hours of station data (4 values per hour). This was done to try to reduce the effect of bad foF2 values. This may mean that the map may lag actual ionospheric behaviour by about an hour, particularly at local dawn periods. The black line in the map represents the geomagnetic equator. This is where the the magnetic dip is zero. Magnetic dip results from the tendency of a compass needle to align itself vertically with the geomagnetic field, pointing upwards in the northern hemisphere, and downwards in the southern hemisphere. Where the magnetic field is parallel to the Earths surface, the dip angle is zero and this is referred to as the geomagnetic equator. The geomagnetic field influences the structure of the ionosphere. |
Credits:
Space Weather Images and Information (excluded from copyright) courtesy of:NOAA / NWS Space Weather Prediction Center
Mauna Loa Solar Observatory (HAO/NCAR)
SOHO (ESA & NASA).
Space Weather links:
3-Day Forecast of Solar and Geophysical Activity
Space Weather Overview
LASCO Coronagraph
Real-Time Solar Wind
Space Weather Advisory Outlooks
Space Weather Forecast Disussions
Space Weather Alerts, Watches and Warnings
Solar and Heliospheric Observatory (SOHO)
The Very Latest SOHO Images
Powered by Space Weather PHP script by Mike Challis
additions by Martin of Hebrides Weather, Ken True of Saratoga Weather,
Jerry Wilkins of Southeast Lincoln Weather and Jeremy Dyde of Jerbils Weather